Editor’s NoteWelcome to the most recent issue of Innovations in Oncology Management™, a newsletter series providing up-to-date information on current issues that are directly affecting the management and business of cancer care in the community. This sixth newsletter in the second series has been developed for oncology practice administrators, administrative staff, advanced practice clinicians, and oncology pharmacists. The current newsletter focuses on health benefits and care delivery trends in oncology. The US healthcare financing system has remained unchanged since the introduction of Medicare and Medicaid; however, aspects of how care has been delivered and insured have changed dramatically over the past decade. In addition, the amount that consumers and patients are being asked to pay is impacting affordability and threatens the viability of the system. These issues have significant implications for the oncology practice, in terms of patient access to providers and to specialty pharmaceuticals, accounts receivables, and bad debt. The information presented in this article outlines key changes relevant to oncology practices as they adapt to higher patient out-of-pocket costs, increased specialty pharmacy distribution, alternate care delivery and payment structures, and value-based quality incentives. We hope that you find this newsletter to be a valuable resource for your practice. Previous issues have explored a variety of topics related to oncology practice administration and can be found at www.innovationsinoncologymanagement.com. |
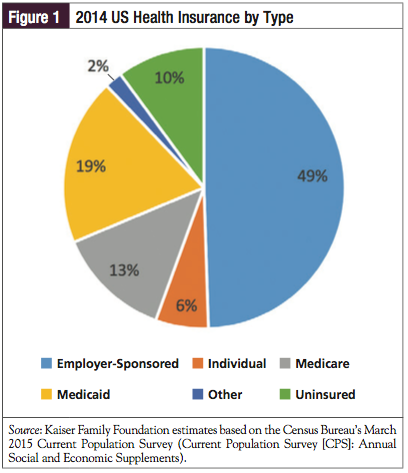
The US healthcare financing system has remained virtually unchanged since the introduction of Medicare and Medicaid; however, aspects related to how medical care has been delivered and insured have changed dramatically over the years. The principal purchasers have been (1) employers, who sponsored plans for their employees; (2) the federal government, which sponsored plans for the elderly and the poor, as well as for the military, public health service, and Veterans Administration; and (3) individuals purchasing their own care, either directly or through insurers (Figure 1). The more dynamic changes have involved how insurers reimbursed physicians and hospitals, and how the relationship among payers, providers, and consumers has changed over time. In the trickle-down economics of healthcare finance and delivery, consumers and patients alike experience the effects through changes in health benefit design, which ultimately result in new financial responsibilities, limitations in the physicians with whom they are able to consult, and incentives/disincentives to seek care and preventive services. This article reviews some of the major health benefit design trends and their implications for oncology practices.
A Simplified Evolutionary Time Line
In 1965, President Lyndon B. Johnson signed amendments to the Social Security Act, initiating the Medicare and Medicaid programs.1 The 1965 legislation spawned Medicare Part A and Part B, which covered physicians and hospital services, and medications administered by them. As of 2014, Medicare covered 53.8 million people (44.9 million aged ≥65 years; 8.9 million disabled).2 As more people gained access to employer-sponsored private healthcare insurance, which was dominated by Blue Cross and Blue Shield plans in the 1950s through 1970s,3 healthcare costs rose steadily, prompting the federal government to seek ways in which to curb the annual growth (by the early 1970s, healthcare costs represented approximately 7% of total spending).4 The result was the Health Maintenance Organization (HMO) Act of 1973, encouraging the start-up and growth of HMOs.4 In 1982, the Tax Equity and Fiscal Responsibility Act introduced what would become Medicare Part C, allowing these HMOs to organize care for Medicare beneficiaries.5 By 2014, approximately 30% of Medicare beneficiaries received their Part A and Part B health services through Part C (Medicare Advantage) plans.2
In 2003, the Medicare Modernization Act (MMA) changed Medicare’s long-standing policy of not covering outpatient prescriptions (ie, it had been covering only Part B medications that were administered in a physician’s office or in a hospital/clinic setting).6 In a major shift, the government created Medicare Part D coverage for outpatient prescriptions, and a new system of private insurers (Part D plans) and existing Medicare Advantage plans were granted permission to administer the new benefit.
The MMA also instituted average sales price (ASP) methodology for reimbursing Medicare Part B buy-and-bill medications, including oncolytics. Originally set at ASP +6%, reimbursement was lowered to ASP +4.3% as a result of the budgetary sequester, rendering the traditional buy-and-bill system less attractive as an area of profit for physician practices.7 Many payers have followed suit for their commercial populations as well, switching their physician office–administered medications to ASP methodology. A 2012 survey of payers revealed that they were implementing several strategies in addition to utilizing ASP-based reimbursement, such as restricting the site of infusion networks (Figure 2).8 A 2007 sample of hematology/oncology practices found that Part B drug revenues had leveled off since the introduction of the MMA.9

Implemented in 2012, the Affordable Care Act (ACA) introduced the use of subsidies and an expansion of Medicaid, to lower the number of uninsured Americans. From 2010 onward, the federal government, through its Center for Medicare & Medicaid Innovation, has been piloting new models, such as accountable care organizations (ACOs), to change the ways in which care is reimbursed, and to incentivize care coordination and prevention.
Trend 1: Rising Costs, Less Affordability
Instability on the Exchanges
Throughout this time line, healthcare costs have risen at varying rates, sometimes influenced by new entitlements, by new benefit coverage mandates, or simply by inflation. The nation’s health expenditures rose less than 5% annually for the fifth consecutive year in 2013—the most recent annual figures available from the federal government.10 According to this analysis, US healthcare spending was 3.6% higher than in 2012, reaching approximately $2.9 trillion in total (representing 17.4% of the gross domestic product).10
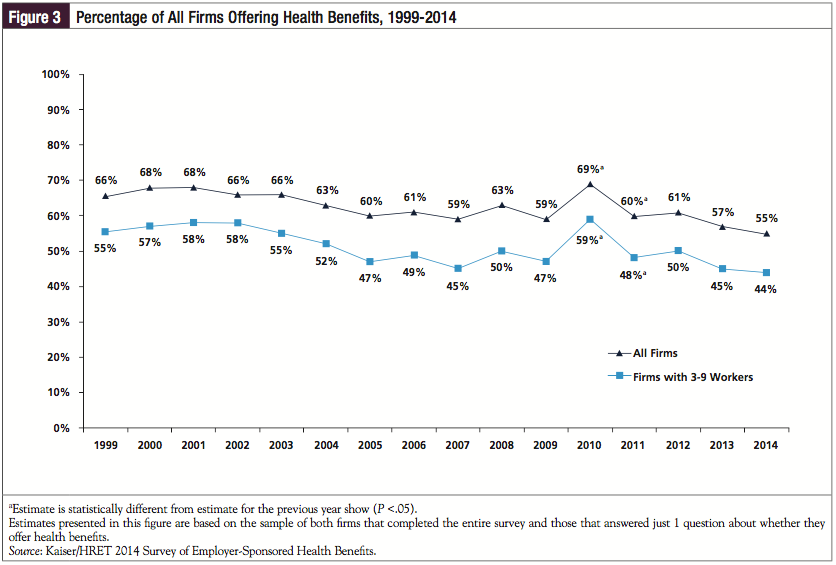
For individuals, the rising costs of coverage convinced some who paid for their own insurance to drop their plans or to remain outside the insurance system entirely. For employers, the costs of sponsoring healthcare plans for their workers compelled many to drop coverage or to use several mechanisms to shift costs to their employees (Figure 3).11 For example, businesses affected during the Great Recession closed down, laid off workers (contributing to a growing uninsured population), shifted costs to employees, or cut benefits,12 which, in turn, served as an impetus for the signing of the ACA in 2012.
The healthcare exchanges introduced by the ACA were expected to keep premiums down by stimulating more competition for small group and individual policies. The exchanges (also known as marketplaces) are administered in 2 ways13:
- State-based exchanges for those states that have undertaken the effort to start and maintain their own access point for consumers and companies to purchase plans from local insurers (13 states plus the District of Columbia)
- HealthCare.gov, which is the federal exchange marketplace that serves consumers in states without their own exchange (37 states).
Changes in health premiums on the exchanges seem to vary widely, based on geographic locale. A report on premium changes expected for 2016 in the silver exchange plans, for example, shows that, in some locations, actual reductions in premiums are evident (eg, an average -10.6% change in Seattle), but many other locations are seeing dramatic increases (eg, 38.4% in Nashville).14
Some insurers, such as UnitedHealthcare, have been wary of the exchanges. Although it decided to hold off participation when it first opened, UnitedHealthcare’s executives pushed forward in 2015, anticipating rapid growth. Most recently, however, it announced a reconsideration of its exchange business, citing anticipated losses.15
One of the exchange innovations encouraged under the ACA—the state health insurance cooperative plans—has been experiencing growing pains. Instability in the finances of the cooperatives has resulted in one-third having ceased operations or planning to do so16; this included the largest of the new cooperatives, Health Republic Insurance of New York.17 The initial subsidies that were intended to give the cooperatives time to gain traction were cut substantially, yielding less time to reach financial stability in the midst of adverse selection. In late November 2015, the Centers for Medicare & Medicaid Services announced that shortfalls in these “risk corridor payments” in 2014 fell far short of what are owed to plans for accepting members who utilize relatively higher amounts of health resources.18,19
Policy analysts are watching the exchanges carefully. An evaluation by the Kaiser Family Foundation revealed that, in early 2015, an average of 6.1 insurer groups offered coverage in each state—up from an average of 5.0 in 2014.20 This also varies considerably from state to state. The federal government believes that the vast majority of consumers shopping on the federal exchange have at least 3 insurers from which to choose products in 2016.20
Increasing Out-of-Pocket Costs for Patients
This problem with the exchanges may reflect a greater problem in terms of costs to consumers. For middle-class consumers, unsubsidized, “low-cost” plans are rarely inexpensive. When combined with the cost of shared premiums (an average of $4995 contributed by a worker in a family plan21), high deductibles,21 and copays/coinsurance, the practical affordability of plans such as these is questionable.22
The expansion of Medicaid and the use of subsidies are supposed to make care more affordable for the lower middle class, and, at the same time, mitigate any negative utilization experience encountered by newly insured patients with chronic disease. Medicaid expansion stalled, however, with 31 states, including the District of Columbia, increasing their income eligibility limits (as of December 17, 2015).23
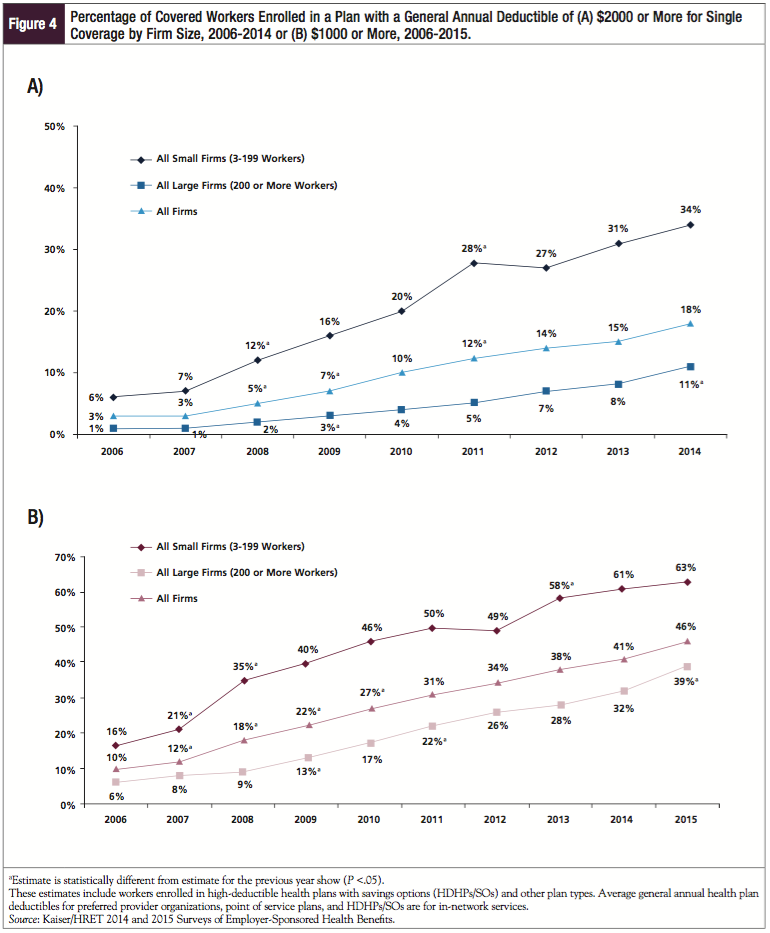
Health plan deductibles are on the rise throughout the health insurance system (Figure 4).11,21 For bronze, silver, and even gold exchange (or “marketplace”) plans, these deductibles may be several thousand dollars.24 In addition, significant cost-sharing in the form of coinsurance for procedures or specialty pharmaceuticals, such as those often used for oncology treatment, is also increasing.25
Higher out-of-pocket costs place patients at risk for being unable to pay for their care. This has several implications for practices, which are discussed in a separate section. At worst, they add to the risk for medical bankruptcy in patients with serious disease and costly treatments.26 The ACA incorporated a consumer protection regulation in the private health plan sector—the maximum out-of-pocket cost. After fulfilling their deductible and reaching the set maximum out-of-pocket cost for an individual or a family, the insurer must pay for the remainder of the care through the term of coverage. For 2015, this was $6600 for an individual plan and $13,200 for a family plan.27
Patients who do not qualify for Medicaid or ACA subsidies may find it challenging to afford treatment, particularly when subject to deductibles. For patients who are prescribed specialty pharmaceuticals, this may mean paying thousands of dollars per month until their deductible is reached and then hundreds of dollars per month in coinsurance until their maximum out-of-pocket costs are reached. For these individuals, patient assistance and copay assistance programs may influence whether they receive their medications and adhere to prescribed regimens.
Trend 2: Narrow Provider Networks
One mechanism for keeping health plan costs affordable for consumers and plan sponsors is to decrease the size of the provider network (both physicians and hospitals).21 When the network size is smaller, the payer has more leverage to ratchet down reimbursement for services and procedures.
In some cases, inclusion of providers in narrow networks may be based on ratings of quality or efficiency.21 The measures of performance in “high-performing” provider networks are generally defined by the payer. By excluding “lower-performing” practices and hospitals, and by contracting selectively with higher-performing providers, insurers and other payers seek to incentivize better quality of care provided while lowering the costs of care—assuming that high quality of care will result in greater efficiency.28
Narrow networks are becoming more common in the health exchanges and commercial plans.21 Questions regarding the adequacy of these networks in serving patients still need to be addressed.29
Trend 3: The Rise of ACOs and Other Innovative Delivery Structures
For hospitals and health systems, the call to form ACOs and similar structures has been difficult to resist. The medical ACO model is beginning to influence oncology practices. In a 2013 survey by the American Society of Clinical Oncology (ASCO), 32% of responders indicated that they expected to be impacted by an ACO model within the following 12 months. Of those responding “yes,” an additional 27% believed that they would be sharing in the ACO’s risk/reward.30
For physicians, including specialists, the lure of consolidation has been similarly attractive, particularly in a market that has begun to focus more on smaller networks, tighter reimbursement, and higher practice costs (including the need to invest in electronic medical record systems).31
Payers and oncology groups have just begun taking a hard look at whether the patient-centered medical home model that has been introduced for primary care practices also makes sense in oncology practices.32,33 This concept leverages the idea that a team approach, using evidence-based guidelines, improves care and is cost-effective. In this model, coordination of care may result in more efficient care and thus shared savings.
Although the oncology medical home model is in its infancy, another innovation in the relationship between paying for and providing oncology care may be a bit more advanced. Based on its implementation in other disease states and in hospital care, the use of bundled payments seems to be generating interest in the oncology setting.34,35 Overall, 40% of plans surveyed in 2013 reported that they have either already implemented or plan to implement within 12 months bundled payments for oncology care.8 Often provided in the form of “episodes of care,” these payments are intended to cover all care for a patient, possibly including pharmaceutical therapies.35 This places the provider at risk for care, thus incentivizing members of the treatment team to be more efficient in the service component of care. At the same time, it may also discourage providers from seeking profits through the drug buy-and-bill system.
Plans and purchasers may decide to “carve out” the oncology benefit, leaving it up to a third party to implement the bundled payment, while the payer limits their risk to a capitated per-member per-month payment (unpublished survey, Health Payer Council, www.healthpayercouncil.com, November 2015).
One of the reimbursement innovations that large payers have instituted involves the use of clinical pathways—that is, relying on professional practice guidelines as a basis for reimbursement. With any of these innovative oncology care delivery and payment models, the reimbursement system must be based on the quality of care and outcomes delivered, rather than on the volume of care, which translates to a shift away from traditional fee-for-service payments for the various members of the care team.34,35
Trend 4: Specialty Pharmaceuticals and the Medical Pharmacy Benefit Divide
Another major factor driving the cost of coverage is the rising expense associated with new prescription drugs, with specialty pharmaceuticals such as oncology agents being a significant contributor to this trend. Based on an analysis by the pharmacy benefit manager Express Scripts, an upward trend of 13% in 2014 was driven in large part by the utilization and pricing of specialty pharmaceuticals.36 The costs associated with specialty medications are increasing at an average annual rate of 15% to 20%, taxing payers’ pharmaceutical budgets. Up to 80% of health plans consider oral oncology agents to be specialty pharmaceuticals, with up to 70% regarding infusible oncology medications in a similar fashion.8
Health plans use several tools to help manage these costs. Depending on the disease state and number of alternative treatments already available, these may include the following:
- Aggressively contracting with drug manufacturers for discounts and rebates
- Implementing closed drug formularies (ie, having the option to exclude a particular medication from being reimbursed or covered)
- Adding prior authorization, partial fill, or step-therapy requirements before a drug is covered (ie, tightening utilization management)
- Increased cost-sharing for members through higher deductibles or coinsurance, such as a specialty drug tier (ie, modifying benefit design)
- Managing the distribution network through which these agents are available
- Altering provider payments for administration of these agents (ie, implementing site-of-service differentials)
- Shifting medication management from the medical benefit to the pharmacy benefit.
Several of these tools can be implemented only if the drug is managed as part of the pharmacy benefit. For example, the drug formulary generally is managed through the pharmacy benefit, and specialty drug tiering is also a tool of the pharmacy benefit.25 A 2013 survey showed that 53% of plans (representing 42% of health plan lives) have implemented specialty tiers.25 Of these plans, 61% charge patients a coinsurance fee for using specialty drugs, compared with 39% charging a flat copayment, and the use of coinsurance is on the rise.25 Overall, 87% of Part D plans responding to the survey have implemented coinsurance for their specialty drugs.8 Payers are increasingly seeking to cross the medical benefit/pharmacy benefit divide, bringing all of their possible tools to bear on managing the challenging specialty category.
Trend 5: Value-Based Treatment and Evidence-Based Medicine
For many years, oncology benefit management was a low priority for plans; they wanted to ensure that patients with cancer had access to the best care available. In addition, the fact that many cancer therapies were used on an off-label basis made oncology benefit management difficult. Higher biopharmaceutical prices and a new emphasis on value-based treatment have renewed payers’ interest in managing oncology care.
Calculating the value of an oncology drug is rarely clear-cut and often very complex. For example, even for highly effective agents such as tyrosine kinase inhibitors used to treat chronic myeloid leukemia, long-term use of these expensive medications can drive up costs. Therapy with checkpoint inhibitors may cost more than $100,000 per month; oncology treatments costing 10 times less threaten many patients’ capacity to pay (in terms of cost-sharing), as well as the ability of health plans to control costs.37 Essentially, a payer’s value proposition regarding the use of oncology agents is a balance between improving survival rates and quality of life, and incurring significant additional costs. It is difficult to quantify.
Payers’ efforts at improving the value they receive for the money spent on medical interventions have taken many forms, including the broad concept of evidence-based medicine and the specific application of value-based insurance design to health benefits coverage. When coupled with companion diagnostics, plans and purchasers seek to optimize the use of expensive medications in those patients who are most likely to receive the greatest benefit (eg, which oncology medication will deliver the greatest survival benefit in an individual patient).37
ASCO has based its approach to determining value in cancer care on a combination of clinical benefit, toxicity, and cost of treatment. They calculated a “net health benefit” based on overall survival, progression-free survival, or response rates, along with comparative toxicities of alternative regimens.37
Others have taken similar approaches: Memorial Sloan Kettering Cancer Center has developed a cost–benefit analysis tool for 54 oncology treatments approved by the US Food and Drug Administration, and the National Comprehensive Cancer Network has created a patient-centered economic approach.37
Some payers are beginning to engage in outcomes- or risk-based contracting for pharmaceuticals, which rewards manufacturers with higher payments for positive outcomes and lower payments when patient outcomes are not improved with a particular medication. One could move Medicare Part B medications to Part D, via which other contracting tools, through the pharmacy benefit, can be used. This could have the effect, however, of exposing more patients with cancer to financial distress.
Challenges to Oncology Practices
A number of marketplace influences are expected to have an impact on oncology practices in the near future. Payers’ actions to keep plan premiums affordable are adding cost pressures to consumers but are also affecting providers. The move to narrower provider networks, which seems to be accelerating with lower-priced plans on health exchanges, could mean that oncologists will have to accept lower reimbursements to maintain network status.
Payer Mergers and Acquisitions
An additional forcing factor—the consolidation of the payer market (eg, Aetna-Humana, Cigna-Anthem mergers)—could similarly provide the resulting larger entities with high market shares. Recent merger and acquisition activity has generated a great deal of discussion at the federal level and in the media with regard to their effect on competition, supposed cost-savings to the system, and potential leverage on providers.38
Rising Accounts Receivable and Bad Debt
According to an ASCO survey, pharmaceutical purchases represent the largest practice expense incurred by oncologists, and with slim margins, management of accounts receivable and bad debt is critical.30 Based on this survey, 87% of oncology practices still participated in the buy-and-bill system in 2012.30 Although buy-and-bill has not gone away, rising accounts receivable may convince some to focus less on in-office administration of infusible treatments.
However, this and a number of other factors compel practices to consider the potential for higher accounts receivable, longer collection times, and more bad debt. Patients are being asked to contribute a larger coinsurance for their office portion of the bill, in addition to higher premiums. In the case of specialty pharmaceuticals, patient cost-sharing can amount to thousands of dollars. Add to that increasing premiums as well as deductibles, and the result is a potent mix of factors that can increase bad debt and make cash flow more difficult to predict.
Challenges to Patient Adherence
High patient cost-sharing is related directly to medication adherence, even in the oncology setting.39 In a study of women with breast cancer who were receiving a brand-name aromatase inhibitor versus a generic version, as monthly out-of-pocket copayment amounts increased, rates of medication adherence decreased.39 With potentially large cost-sharing amounts for specialty medicines, one would expect this to be a formidable barrier to adherence, even in oncology.
High patient cost-sharing underscores the need for improved access to patient assistance and copayment programs offered by manufacturers. The physician’s office can be an important source of access to these programs, optimizing patients’ ability to continue to pay for their treatment.
Narrow Networks
The current trend toward narrow provider networks has several implications for the practice of medicine. From a practical standpoint, this can be disruptive to the physician–patient relationship: a person who switches plans may find that his or her current physician is no longer in the network. In high-performing networks, information technology is usually required to meet the reporting requirements (ie, electronic medical records and data analysis). Small practices may not be able to spread the investment in overhead costs in the way that larger practices can. As a result, narrow networks may have a bias toward larger practices (and their ability to work with lower payments and greater quality reporting requirements).
Newer Reimbursement Models
Although the use of clinical pathways and delivery models, such as oncology medical homes, may simplify reimbursement, it may also provide oncologists with greater latitude in treatment without having to comply with time-consuming prior authorizations and appeals for medical exceptions associated with managed care. Furthermore, an oncology medical home may offer the opportunity to improve coordination of care for patients with cancer and place the oncology practice closer to the position of “principal care provider.”
On the Horizon
The drug pipeline is brimming with new oncology agents that hold the promise of being more effective but also more expensive than older medications. Add to this the likelihood of more combinations of therapies being used in clinical practice, and health plans and payers in general will want to focus greater efforts on managing oncology care than in the past.
It is unlikely that the outcome of the 2016 presidential election will result in the repeal of the ACA, based simply on the number of people covered under the exchanges and the expansion of Medicaid. Modifications to the ACA may be expected, however, and it now appears that implementation of the “Cadillac plan” tax will be delayed by 2 years (now scheduled to begin in 2020 rather than in 2018).40 This tax on health benefit plans deemed to be high cost is of concern because of its unintended consequences. The fear is that, in the coming years, as health plan premiums continue to rise, instead of applying to the most expensive and generous plans, this tax may affect up to 42% of all health plans by 2028.41 As a result, plan sponsors today are preparing to bypass the tax, by increasing cost-sharing and considering their alternatives, such as restricting benefits and defined contributions. This may further pressure patients and consumers to pay for more of their healthcare (or increase the number of uninsured), which could ultimately lead to more bad debt or uncompensated care for practices.
Other possible ACA modifications may occur in the area of mandated benefits (both the implementation of additional mandates, which could drive up costs, or the removal of others, which could help stem the growth in premiums). There are limitations to what benefit restrictions will be acceptable to consumers, employers, and other purchasers, however, and what individual patients can afford to pay.
Conclusion
As this review suggests, the issue of affordability of care threatens the financial viability of the US healthcare system, and its implications for oncology practices are significant. Cost discussions with patients and their families may be an increasingly common part of oncology treatment planning.
Most experts agree that we are getting perilously close to a “tipping point,” when additional consumer cost-sharing will not be possible without a resultant loss of access to care. Over the past few years, the rise in health plan premiums has been limited to single digits, but the inflationary pressures are powerful, despite regulatory and marketplace attempts to limit their effect. To sustain revenues and profitability, oncology practices will need to be proactive in adjusting to new delivery models and reimbursement schemes.
References
1. US National Archives & Records Administration. Social Security Act Amendments (1965). www.ourdocuments.gov; 2015. www.ourdocuments.gov/doc.php?flash=true&doc=99. Accessed November 22, 2015.
2. Centers for Medicare & Medicaid Services (CMS). 2015 Annual Report of the Boards of Trustees of the Federal Hospital Insurance and Federal Supplementary Medical Insurance Trust Funds. July 22, 2015. www.cms.gov/research-statistics-data-and-systems/statistics-trends-and-reports/reportstrustfunds/downloads/tr2015.pdf. Accessed November 22, 2015.
3. Lichtenstein M. Health Insurance From Invention to Innovation: A History of the Blue Cross and Blue Shield Companies. Blue Cross Blue Shield Association. 2015. www.bcbs.com/blog/health-insurance.html. Accessed November 22, 2015.
4. Markovich M. The Rise of HMOs. RAND Corporation; 2003. www.rand.org/pubs/rgs_dissertations/RGSD172.html. Accessed December 15, 2015.
5. McGuire TG, Newhouse JP, Sinaiko AD. An economic history of Medicare Part C. Milbank Q. 2011;89:289-332.
6. Centers for Medicare & Medicaid Services (CMS), HHS. Medicare program; Medicare prescription drug benefit. Final rule. Fed Regist. 2005;70:4193-4585.
7. Mehr SR. Sequester forcing chemo treatments into hospitals costing taxpayers more in the end. Am J Manag Care. 2013;19:SP207-SP208.
8. EMD Serono Specialty Digest™, 10th ed. EMD Serono. 2014. http://specialtydigest.emdserono.com/pdf/Digest10.pdf. Accessed November 21, 2015.
9. Ballou J, Chen A, Cheh V, et al; Mathematica Policy Research, Inc. Part B Drug Payment Reform: Lower Expenditures Without Signs of Adverse Effects. Final Report; August 28, 2009. www.cms.gov/Research-Statistics-Data-and-Systems/Statistics-Trends-and-Reports/Reports/downloads/Cheh_PartB_2009.pdf. Accessed December 30, 2015.
10. Centers for Medicare & Medicaid Services. National Health Expenditures 2014 Highlights. www.cms.gov/Research-Statistics-Data-and-Systems/Statistics-Trends-and-Reports/NationalHealthExpendData/Downloads/highlights.pdf. Accessed November 23, 2015.
11. The Kaiser Family Foundation and Health Research & Educational Trust. Employer-Sponsored Health Benefits: 2014 Annual Survey. http://kff.org/health-costs/report2014-employer-health-benefits-survey/. Accessed December 28, 2015.
12. Bernstein J. Changes in Health Care Financing and Organization (HCFO). Issue brief: Impact of the Economy on Health Care; August 2009. www.academyhealth.org/files/HCFO/findings0809.pdf. Accessed December 26, 2015.
13. US Department of Health & Human Services, Office of the Assistant Secretary for Planning and Evaluation. ASPE Issue Brief. Health Insurance Marketplaces 2015 Open Enrollment Period: March Enrollment Report. http://aspe.hhs.gov/sites/default/files/pdf/83656/ib_2015mar_enrollment.pdf. Accessed November 21, 2015.
14. Cox C, Gonzales S, Kamal R, et al; The Henry J. Kaiser Family Foundation. Analysis of 2016 Premium Changes in the Affordable Care Act’s Health Insurance Marketplaces. October 26, 2015. http://kff.org/health-reform/fact-sheet/analysis-of-2016-premium-changes-in-the-affordable-care-acts-health-insurance-marketplaces. Accessed December 26, 2015.
15. Mathews AW, Armour S. Biggest insurer threatens to abandon health law. The Wall Street Journal. November 19, 2015. www.wsj.com/articles/unitedhealth-cuts-guidance-evaluating-its-insurance-exchange-segment-1447933310. Accessed December 1, 2015.
16. One Third of Obamacare Co-ops Are Now Officially Dead. The Daily Caller New Foundation. http://dailycaller.com/2015/10/15/one-third-of-obamacare-co-ops-are-now-officially-dead/. Accessed January 5, 2016.
17. Mathews AW. Regulators to Shut Down Health Republic Insurance of New York: Officials cite likelihood that health cooperative would become financially insolvent. The Wall Street Journal. September 25, 2015. www.wsj.com/articles/regulators-to-shut-down-health-republic-insurance-of-new-york-1443222742. Accessed December 1, 2015.
18. Small L. CMS will seek ways to make up for risk corridor shortfall. FierceHealthPayer. November 20, 2015. www.fiercehealthpayer.com/story/cms-will-seek-ways-make-risk-corridor-shortfall/2015-11-20. Accessed December 28, 2015.
19. Small L. What the gov't could do to stop insurers from leaving ACA marketplace. FierceHealthPayer. December 1, 2015. www.fiercehealthpayer.com/story/what-govt-could-do-stop-insurers-leaving-aca-marketplace/2015-12-01?utm_medium=nl&utm_source=internal. Accessed December 1, 2015.
20. Cox C, Claxton G, Levitt L; The Henry J. Kaiser Family Foundation. Analysis of Insurer Participation in 2016 Marketplaces. http://kff.org/health-reform/issue-brief/analysis-of-insurer-participation-in-2016-marketplaces. Accessed December 28, 1015.
21. The Kaiser Family Foundation and Health Research & Educational Trust. Employer Health Benefits: 2015 Annual Survey. http://kff.org/attachment/report-2015-employer-health-benefits-survey. Accessed December 28, 2015.
22. Luhby T. CNN Money. Obamacare: Is a $2,000 deductible ‘affordable?’ June 13, 2013. http://money.cnn.com/2013/06/13/news/economy/obamacare-affordable/index.html. Accessed November 24, 2015.
23. The Henry J. Kaiser Family Foundation. Status of State Action on the Medicaid Expansion Decision. December 17, 2015. http://kff.org/health-reform/state-indicator/state-activity-around-expanding-medicaid-under-the-affordable-care-act. Accessed December 28, 2015.
24. Herman B. High-deductible plans dominate next open enrollment. Modern Healthcare. November 13, 2015. www.modernhealthcare.com/article/20141113/NEWS/311139966. Accessed November 25, 2015.
25. EMD Serono Specialty Digest™, 11th ed. EMD Serono; 2015. http://specialtydigest.emdserono.com/Digest.aspx. Accessed November 21, 2015.
26. Himmelstein DU, Thorne D, Warren E, Woolhandler S. Medical bankruptcy in the United States, 2007: results of a national study. Am J Med. 2009;122:741-746.
27. ObamaCare Facts. Out-of-pocket Maximum Limits on Health Plans. http://obamacarefacts.com/health-insurance/out-of-pocket-maximum. Accessed December 28, 2015.
28. Haeder SF, Weimer DL, Mukamel DB. Narrow networks and the Affordable Care Act. JAMA. 2015;314:669-670.
29. Greene J. For narrow networks, fresh scrutiny: can they pass the adequacy test? Managed Care. September 2015. www.managedcaremag.com/archives/2015/9/narrow-networks-fresh-scrutiny-can-they-pass-adequacy-test. Accessed December 28, 2015.
30. Towle EL, Barr TR, Senese JL. The National Practice Benchmark for Oncology, 2013 report on 2012 data. J Oncol Pract. 2013;9:20s-38s.
31. Nolan KC. Drivers of Physician-Hospital Consolidation: How to Integrate Successfully. Healthcare Financial Management Association. June 5, 2013. www.hfma.org/Content.aspx?id=17407. Accessed November 23, 2015.
32. National Committee for Quality Assurance. Profile: Adapting Patient-Centered Medical Home Principles and Tools for an Oncology Practice. 2013. www.ncqa.org/Portals/0/Programs/Recognition/Quality%20Profiles-%20PCMH%20ONC%20FINAL.pdf. Accessed November 30, 2015.
33. Tirodkar MA, Acciavatti N, Roth LM, et al. Lessons from early implementation of a patient-centered care model in oncology. J Oncol Pract. 2015;11:456-461.
34. Cantlupe J. Bundled payments come to cancer care. HealthLeaders Media, March 11, 2013. http://healthleadersmedia.com/print/HEP-289965/Bundled-Payments-Come-to-Cancer-Care. Accessed December 29, 2015.
35. Greenapple R. Rapid expansion of new oncology care delivery payment models: results from a payer survey. Am Health Drug Benefits. 2013;6:249-256.
36. Express Scripts®. The 2014 Drug Trend Report. March 2015. http://lab.express-scripts.com/drug-trend-report. Accessed December 29, 2015.
37. Young RC. Value-based cancer care. N Engl J Med. 2015;373:2593-2595.
38. Kendall B, Mathews AW. DOJ girds for strict review of any health-insurer mergers. The Wall Street Journal. June 28, 2015. www.wsj.com/articles/doj-girds-for-strict-scrutiny-of-health-insurer-mergers-1435524588. Accessed December 8, 2015.
39. Hershman DL, Tsui J, Meyer J, et al. The change from brand-name to generic aromatase inhibitors and hormone therapy adherence for early-stage breast cancer. J Natl Cancer Inst. 2014;106(11). pii: dju319.
40. Livingston S. Cadillac tax delay gives employers relief. Business Insurance. December 20, 2015. www.businessinsurance.com/article/20151220/NEWS03/151219784/cadillac-excise-tax-delay-included-in-1-1-trillion-budget-deal-gives?tags=|62|74|
278|307. Accessed December 21, 2015.
41. Claxton G, Levitt L. The Henry J. Kaiser Family Foundation. How many employers could be affected by the Cadillac plan tax? August 2015. http://files.kff.org/attachment/issue-brief-how-many-employers-could-be-affected-by-the-cadillac-plan-tax. Accessed December 9, 2015.